
VWAP Indicator Explained: Everything You Need to Know
The VWAP indicator, or Volume Weighted Average Price, is one of the most trusted tools used by professional traders. It combines price and volume data to show the average price at which an asset has traded throughout the day. In this guide, you’ll understand what VWAP is, how it’s calculated, and how traders use it to make decisions.
What is the VWAP Indicator?
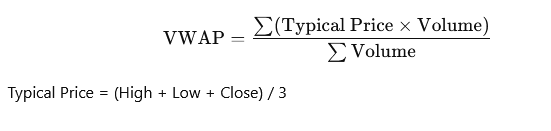
VWAP stands for Volume Weighted Average Price. It is a technical indicator that provides the average trading price of an asset, weighted by volume, over a specific time frame—usually one trading day.
Formula:
How VWAP Works
- It resets at the beginning of each trading session
- It is plotted on a chart like a moving average, but it’s based on both price and volume
- Helps traders identify if the market is bullish (price above VWAP) or bearish (price below VWAP)
Why is VWAP Important?
- Institutions use it to execute large orders without impacting the market
- Retail traders use it to understand market trend and price value zones
- Acts as dynamic support and resistance during intraday trading
VWAP in Action: Chart Example
(Include an annotated chart showing VWAP line on a 5-minute or 15-minute intraday chart)
Advantages of VWAP
- Combines price and volume
- Helps identify mean reversion levels
- Ideal for intraday trading
Limitations of VWAP
- Not suitable for long-term trend analysis
- Can lag in fast-moving or low-volume markets
Best Practices for Using VWAP
- Use it with other indicators (e.g., RSI, MACD) for confirmation
- Best used on short-term charts like 1-min, 5-min, or 15-min
- Always check market context before entering trades
FAQs
1. How do you use the VWAP indicator?
Traders use VWAP to determine market trend and potential entry/exit points. Prices above VWAP suggest a bullish trend; below indicates bearish sentiment.
2. Why is VWAP the best indicator?
VWAP gives a more accurate price by factoring in volume, making it more reliable for intraday decisions compared to price-only indicators.
3. Is VWAP bullish or bearish?
VWAP itself is neutral. However, prices above VWAP often indicate bullish conditions, and below indicates bearish conditions.
4. What is the best timeframe to use VWAP?
The best timeframes are intraday—typically 1-min to 15-min charts.
5. What are the best VWAP settings for day trading?
Use the default intraday VWAP setting (resets daily). No custom inputs are usually needed unless using advanced variations.